Candlestick patterns are an integral part of technical analysis in the financial markets. These patterns provide valuable insights into market sentiment and help traders identify potential buying or selling opportunities. In this article, we will focus on bearish candlestick patterns, which indicate a higher probability of a price decline. Understanding these patterns can empower traders to make informed decisions and enhance their trading strategies. So, let's delve into the top bearish candlestick patterns that generate robust sell signals.
Evening Star

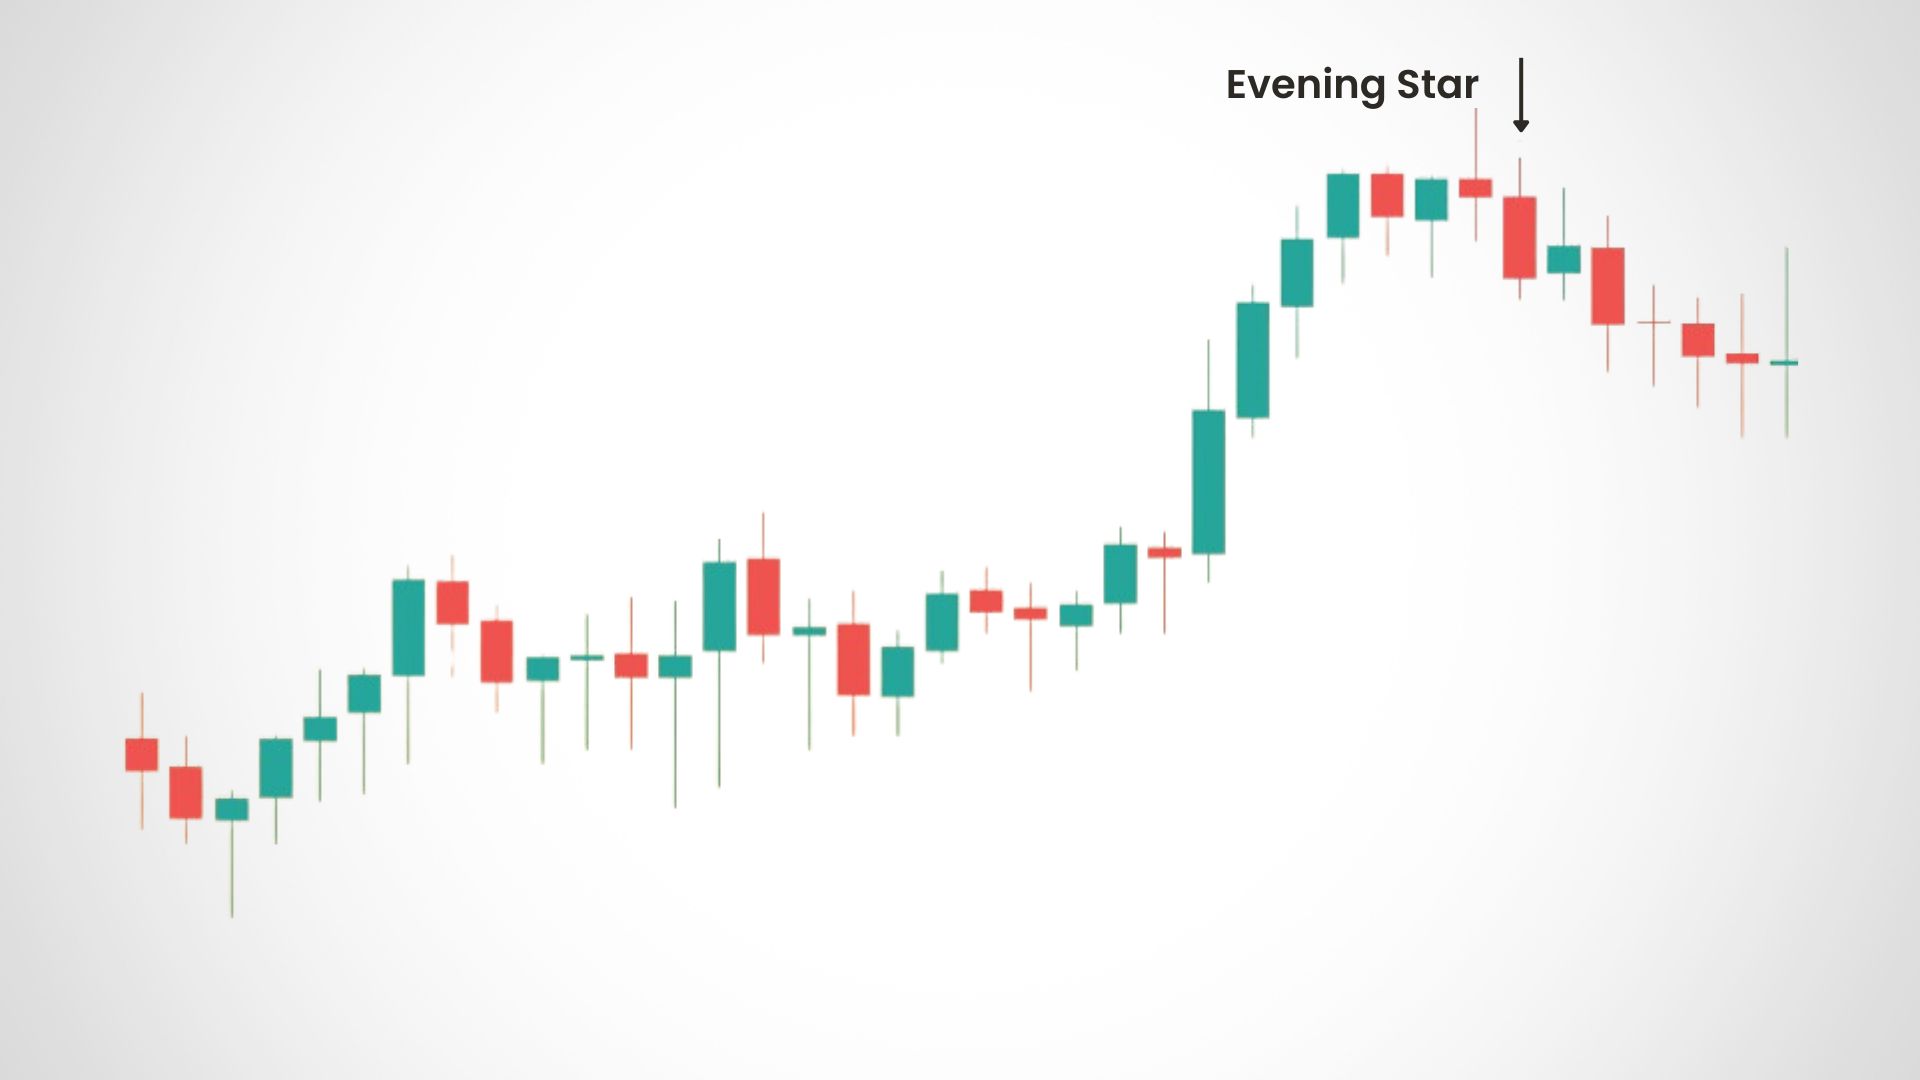
The Evening Star is a powerful bearish reversal pattern that typically forms at the end of an uptrend. It consists of three candles: a large bullish candle, followed by a small-bodied candle (either bullish or bearish) that gaps above the previous candle, and finally, a large bearish candle that closes below the midpoint of the first candle. This pattern suggests a shift in market sentiment from bullish to bearish.
When the Evening Star pattern emerges, it signifies that buyers are losing control, and sellers are gaining momentum. Traders often view this pattern as a signal to sell or take profits on existing long positions. Let's look at an example:
Example: Consider a stock that has been in an uptrend, with prices gradually increasing. On day one, a strong bullish candle forms, indicating the dominance of buyers. On day two, a small-bodied candle with a gap-up opening appears, signifying uncertainty. Finally, on day three, a large bearish candle forms, closing below the midpoint of the first candle. This completes the Evening Star pattern and suggests a potential reversal in the stock's price.
Bearish Engulfing Pattern
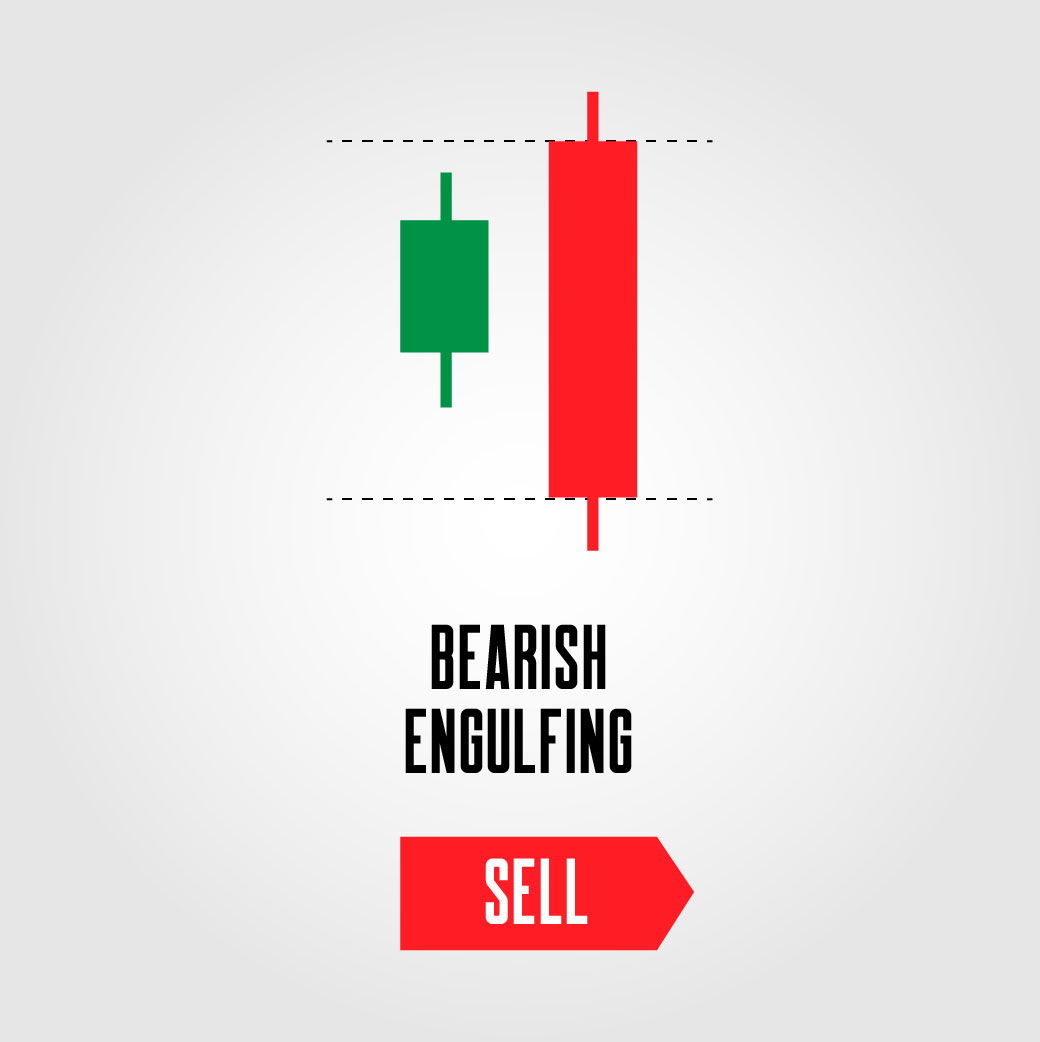
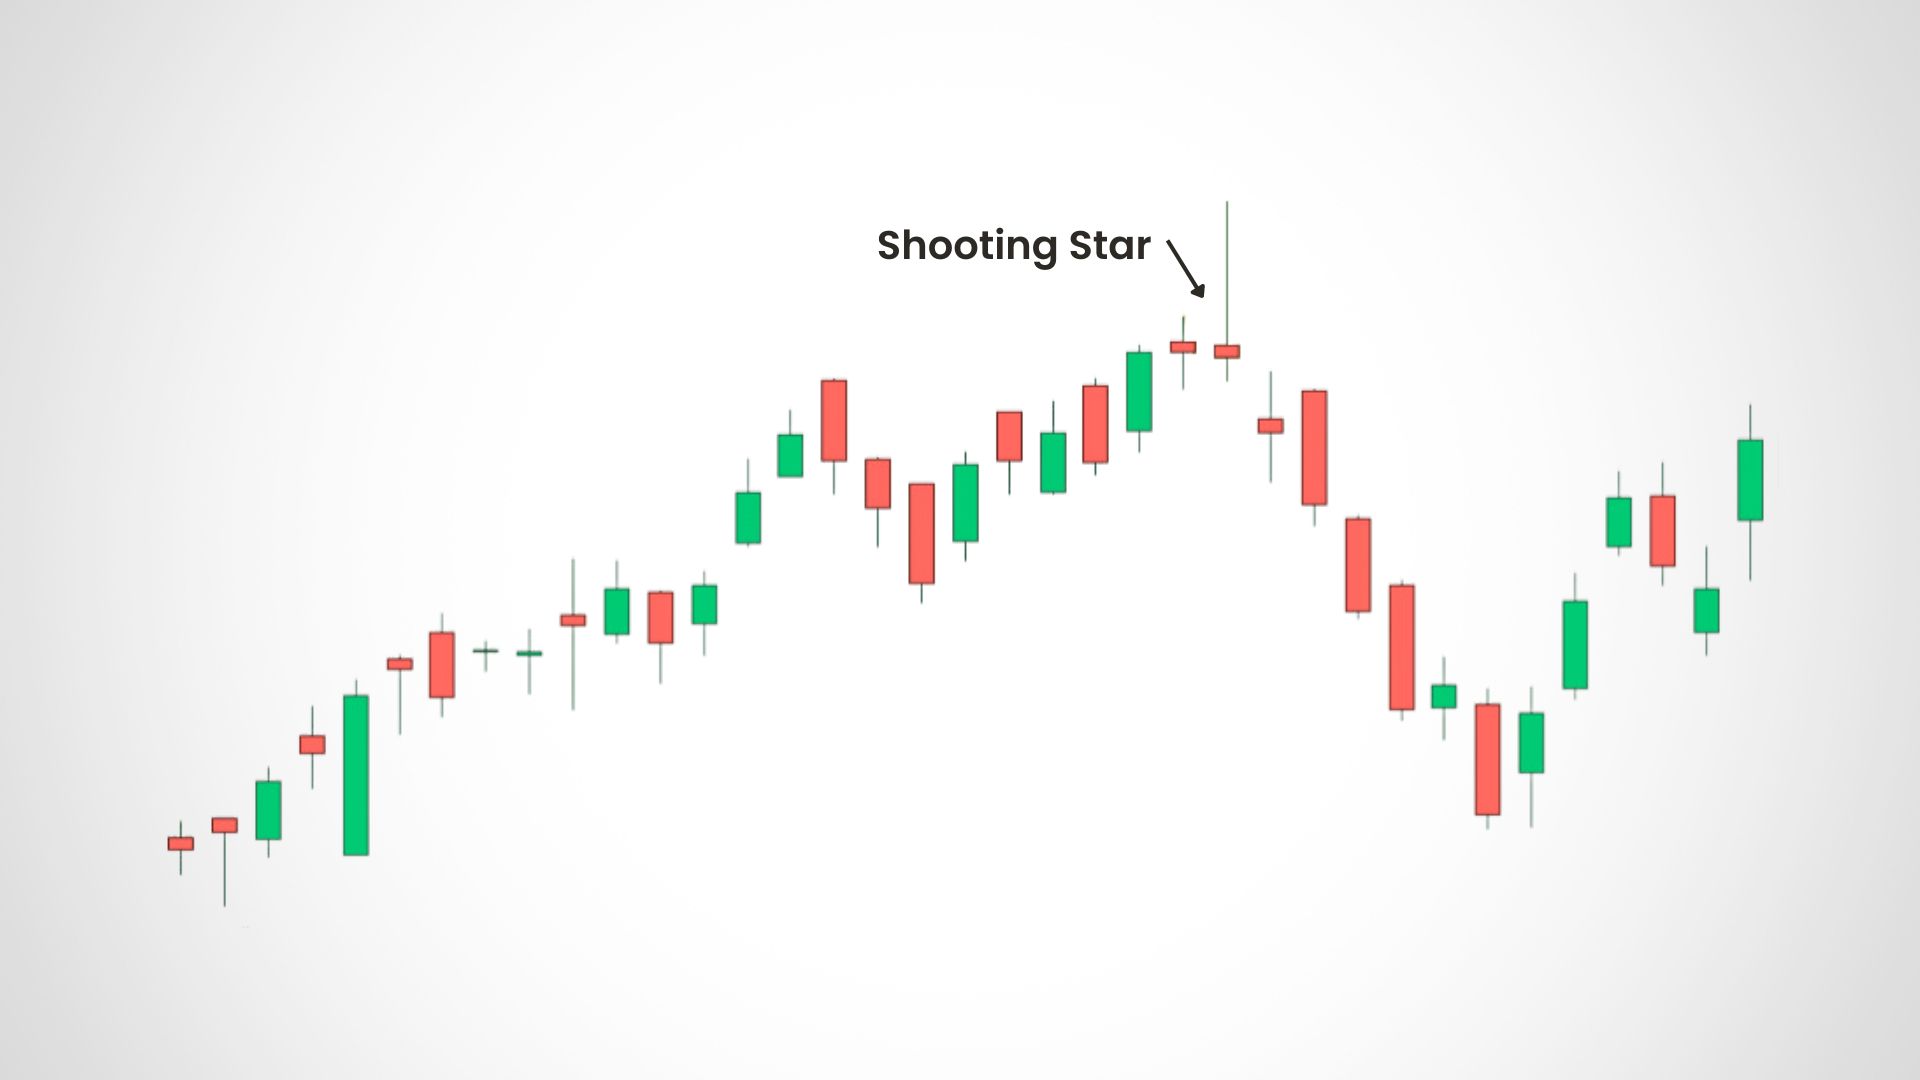
The Bearish Engulfing pattern is another popular bearish candlestick formation that can provide robust sell signals. It occurs when a small bullish candle is followed by a larger bearish candle that completely engulfs the previous candle's range. This pattern suggests a shift in sentiment from bullish to bearish, as selling pressure overwhelms buying pressure.
The Bearish Engulfing pattern highlights a potential reversal in the market, making it a favored choice for traders seeking to initiate short positions or exit long positions. Let's explore an example:
Example: Imagine a stock in an uptrend, represented by a small bullish candle. Following this, a larger bearish candle forms, completely engulfing the previous candle's range. This pattern indicates that sellers have taken control, overpowering the buyers. Traders viewing this pattern as a sell signal might consider entering short positions or liquidating existing long positions.
Shooting Star

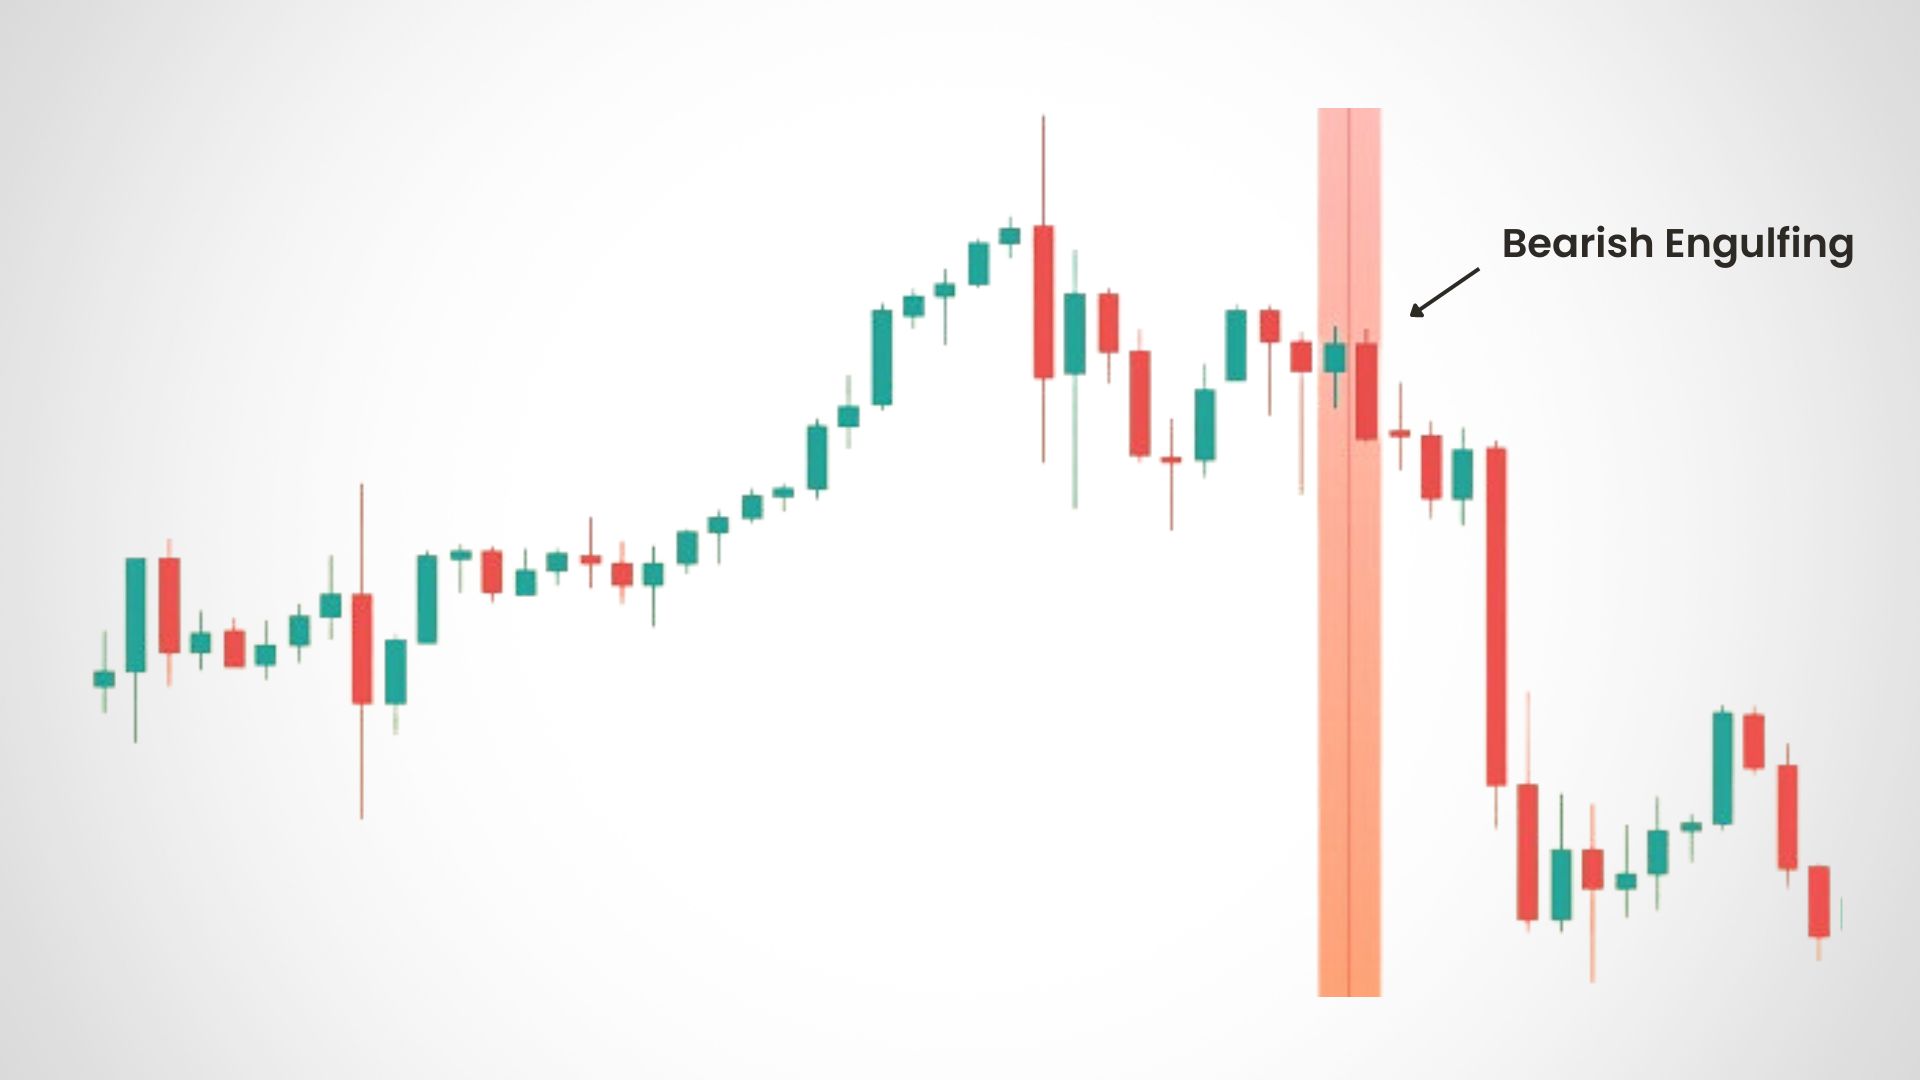
The Shooting Star is a bearish reversal pattern that appears after an uptrend. It consists of a small-bodied candle with a long upper shadow and little to no lower shadow, followed by a bearish candle that closes below the first candle's midpoint. The long upper shadow signifies a failed attempt by buyers to push the price higher.
When a Shooting Star occurs, it suggests a potential reversal of the current uptrend. It indicates that sellers are entering the market, overpowering the buyers. Here's an example:
Example: Let's say a stock has been steadily rising, and a small-bodied candle with a long upper shadow forms. The following candle is bearish and closes below the midpoint of the first candle. This Shooting Star pattern indicates that buyers failed to sustain the upward momentum, and sellers may take control, potentially leading to a price reversal.
Dark Cloud Cover
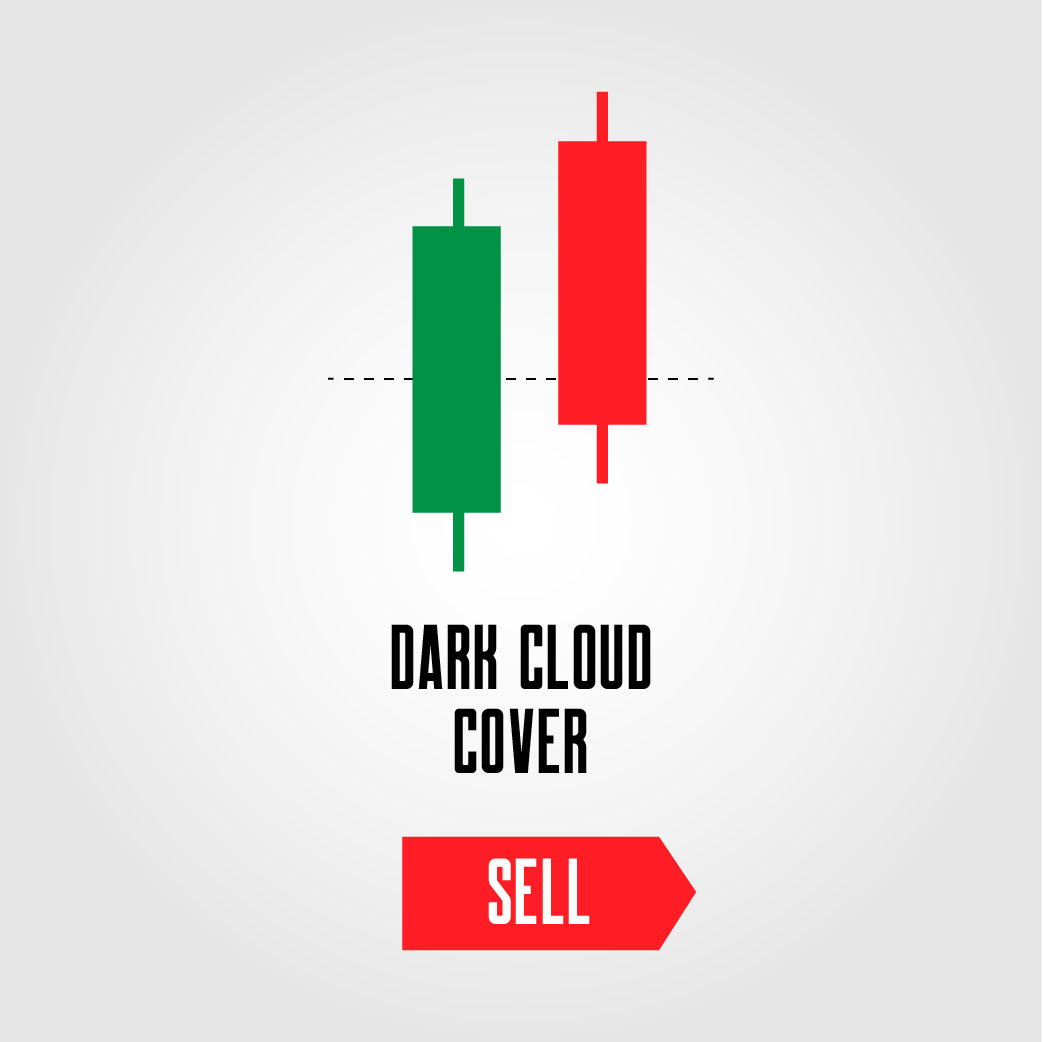
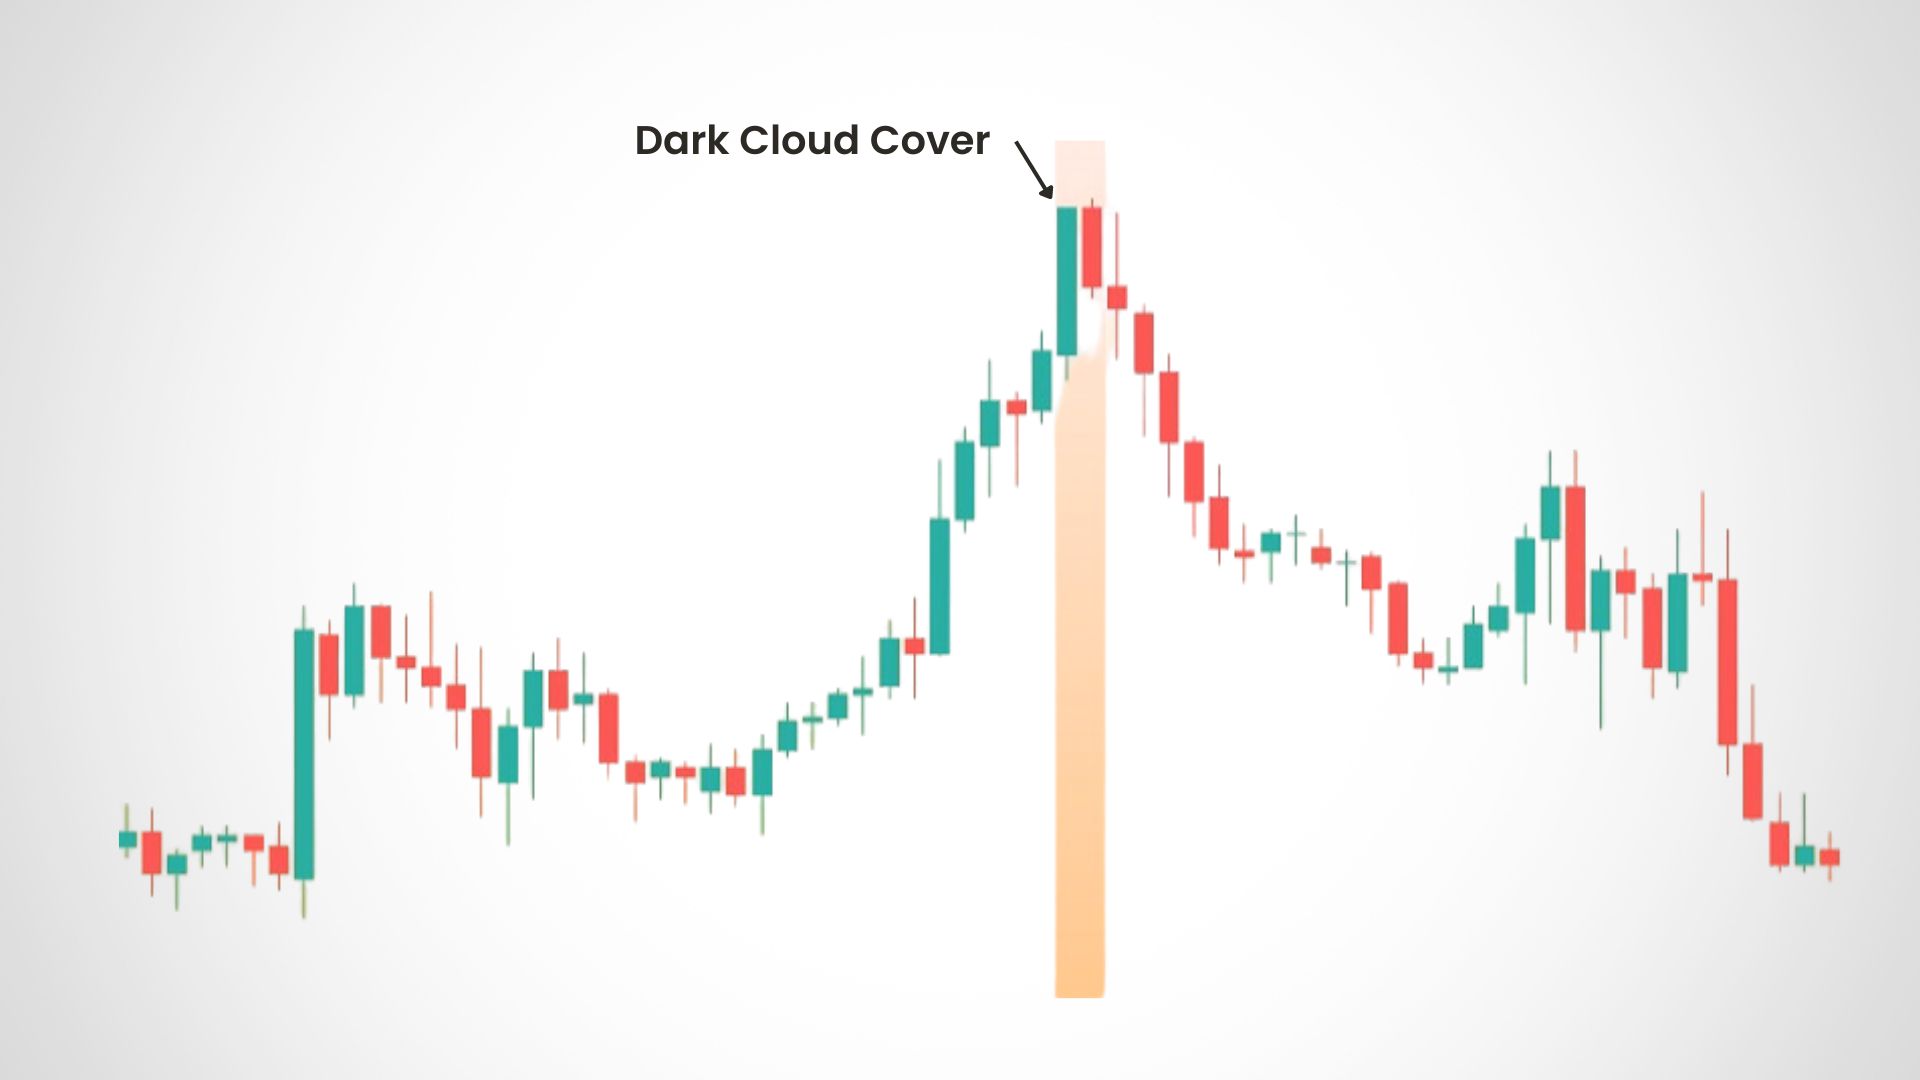
The Dark Cloud Cover pattern is a bearish signal that forms at the end of an uptrend. It consists of two candles: a large bullish candle followed by a bearish candle that opens above the previous candle's high and closes below its midpoint. The bearish candle's close near the previous bullish candle's halfway point indicates a potential shift in market sentiment.
The Dark Cloud Cover pattern suggests that buyers are losing momentum, and sellers might take control. It serves as a warning sign to traders who hold long positions or are considering entering new long positions. Consider the following example:
Example: Suppose a stock has been on an upward trend, represented by a large bullish candle. The next candle opens above the previous candle's high but closes below its midpoint. This completes the Dark Cloud Cover pattern, indicating a potential reversal in the stock's price and signaling a potential sell opportunity.
Final Thoughts
Understanding bearish candlestick patterns is crucial for traders seeking to capitalize on market downturns. These patterns offer valuable sell signals and provide insights into potential reversals. By recognizing and interpreting the Evening Star, Bearish Engulfing Pattern, Shooting Star, and Dark Cloud Cover, traders can enhance their decision-making process and identify profitable opportunities. It is important to note that these patterns should not be relied upon in isolation; confirmation through other technical indicators and analysis is vital for successful trading strategies. Incorporating these bearish candlestick patterns into your trading arsenal can help you navigate the markets with confidence and maximize your trading potential.
