EURUSD
The EURUSD pair continues to trade within a narrow range, with the bulls and bears struggling for control. Here's what you need to know about this instrument:
The Flash Manufacturing PMI for the Eurozone released on March 24th showed a reading of 47.1 falling under the expected 48.9. This indicates that the manufacturing sector in the Eurozone is having a shakedown at a faster pace than anticipated, which could go against the Euro. The Euro Summit is also taking place, where the heads of state from the European Union countries will discuss the economic and financial situation and policy coordination. Any decisions made at this summit could impact the direction of the EURUSD pair.
As previously mentioned, the bulls and bears are struggling for control, with the market trading within a narrow range. The bears are hopeful for a lower-high major trend reversal, but the rally from the March 15th low is strong enough that the first reversal down will likely fail. The bears may need to develop more selling pressure before any major trend reversal. Overall, the market may reach the February 2nd close in the next few days.
Here's an updated chart to help visualize the recent price action:
Based on this analysis, it's important to keep an eye on any news or events that could impact the EURUSD pair, particularly any announcements from the Euro Summit. The Flash Manufacturing PMI data could also have an impact on the pair in the short term.
GBPUSD
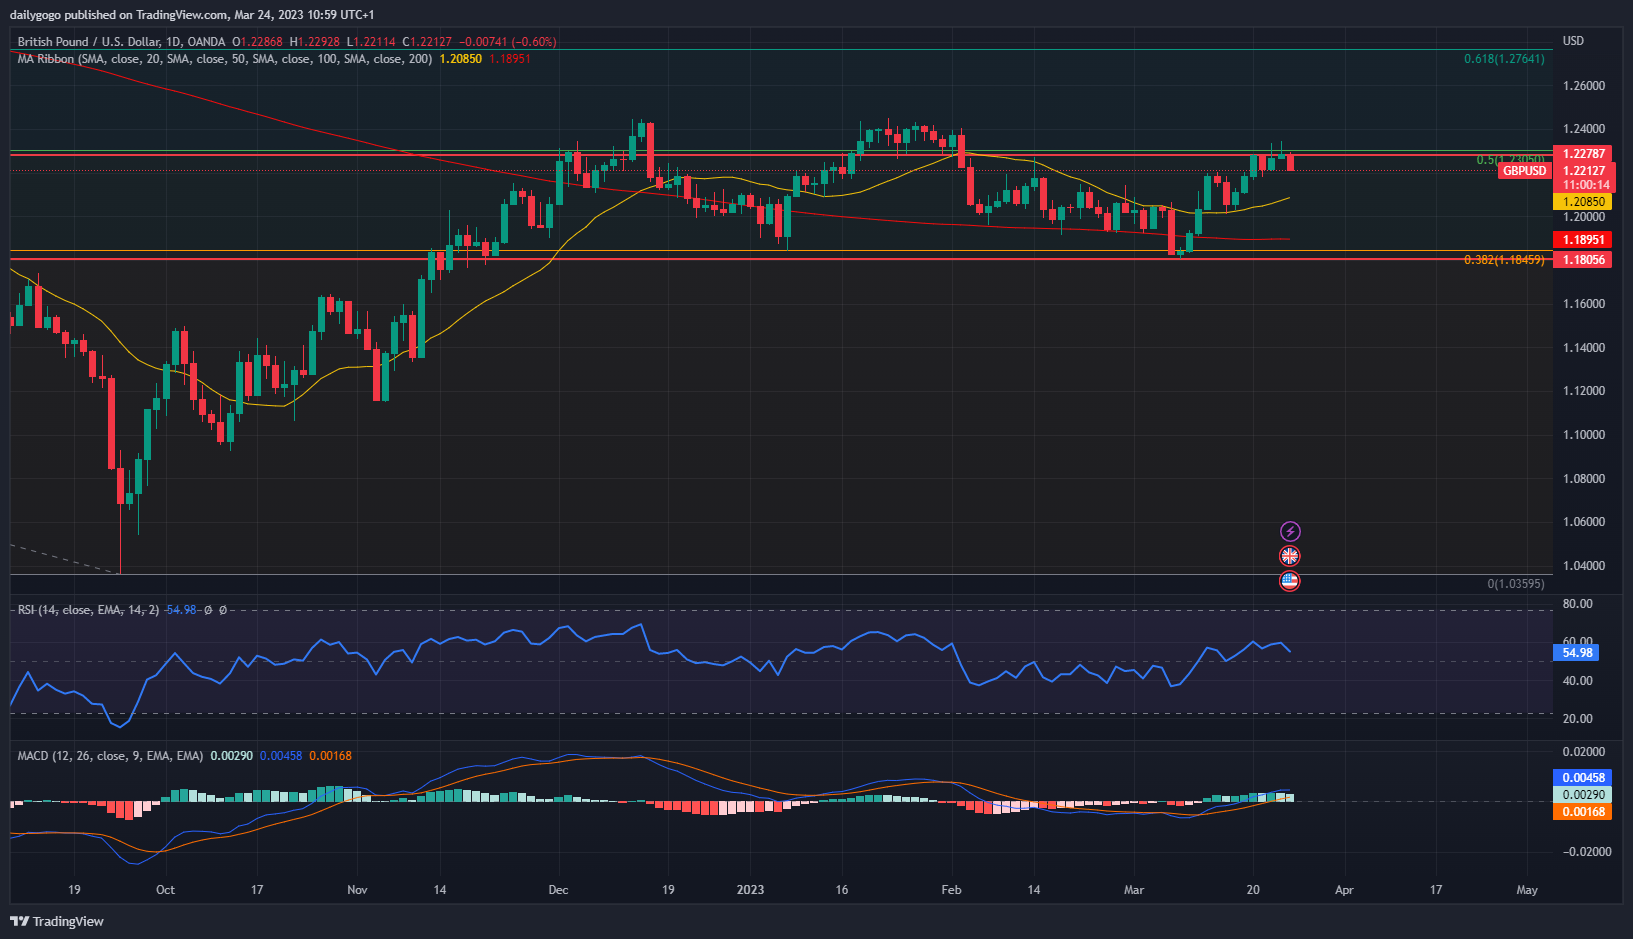
The Bank of England raised its key interest rate by another 25 basis points to a new 15-year high of 4.25%, in an effort to tame double-digit inflation in the UK. The decision comes after the Office for National Statistics reported that inflation rose to 10.4% in February. The GBP/USD currency pair is currently testing a significant technical level, specifically a 0.5% Fibonacci retracement back from May 31, 2021.
GBP/USD is trading 0.1% lower at 1.2271, having touched a seven-week high of 1.2344 on Thursday. The currency pair is testing a key technical level, which could impact its direction going forward.
Economic data: The Flash Manufacturing PMI and Flash Services PMI data for the US are scheduled to be released today at 02:45 pm (GMT+1). Any surprises in these data releases could impact the direction of GBP/USD in the short term.
Here's a chart to help visualize the recent price action:
Based on this analysis, it's important to keep an eye on any upcoming economic data releases that could impact the GBP/USD pair, particularly the Flash Manufacturing PMI and Flash Services PMI for the US. Additionally, any further developments related to the Bank of England's efforts to tame inflation could impact the direction of the currency pair in the coming days.
CRUDE OIL
Crude Oil WTI saw a positive 1.1 million barrel inventory report this week, better than the expected negative 1.7 million barrels.
Tighter credit is the biggest risk in the market right now, but a global oil deficit could occur by June due to OECD skirting a 2023 recession, thirsty Asia buyers, and a fall in Russian production.
The weaker dollar allows for better China fundamentals to shine through, and a bullish play is for OPEC to stay the course.
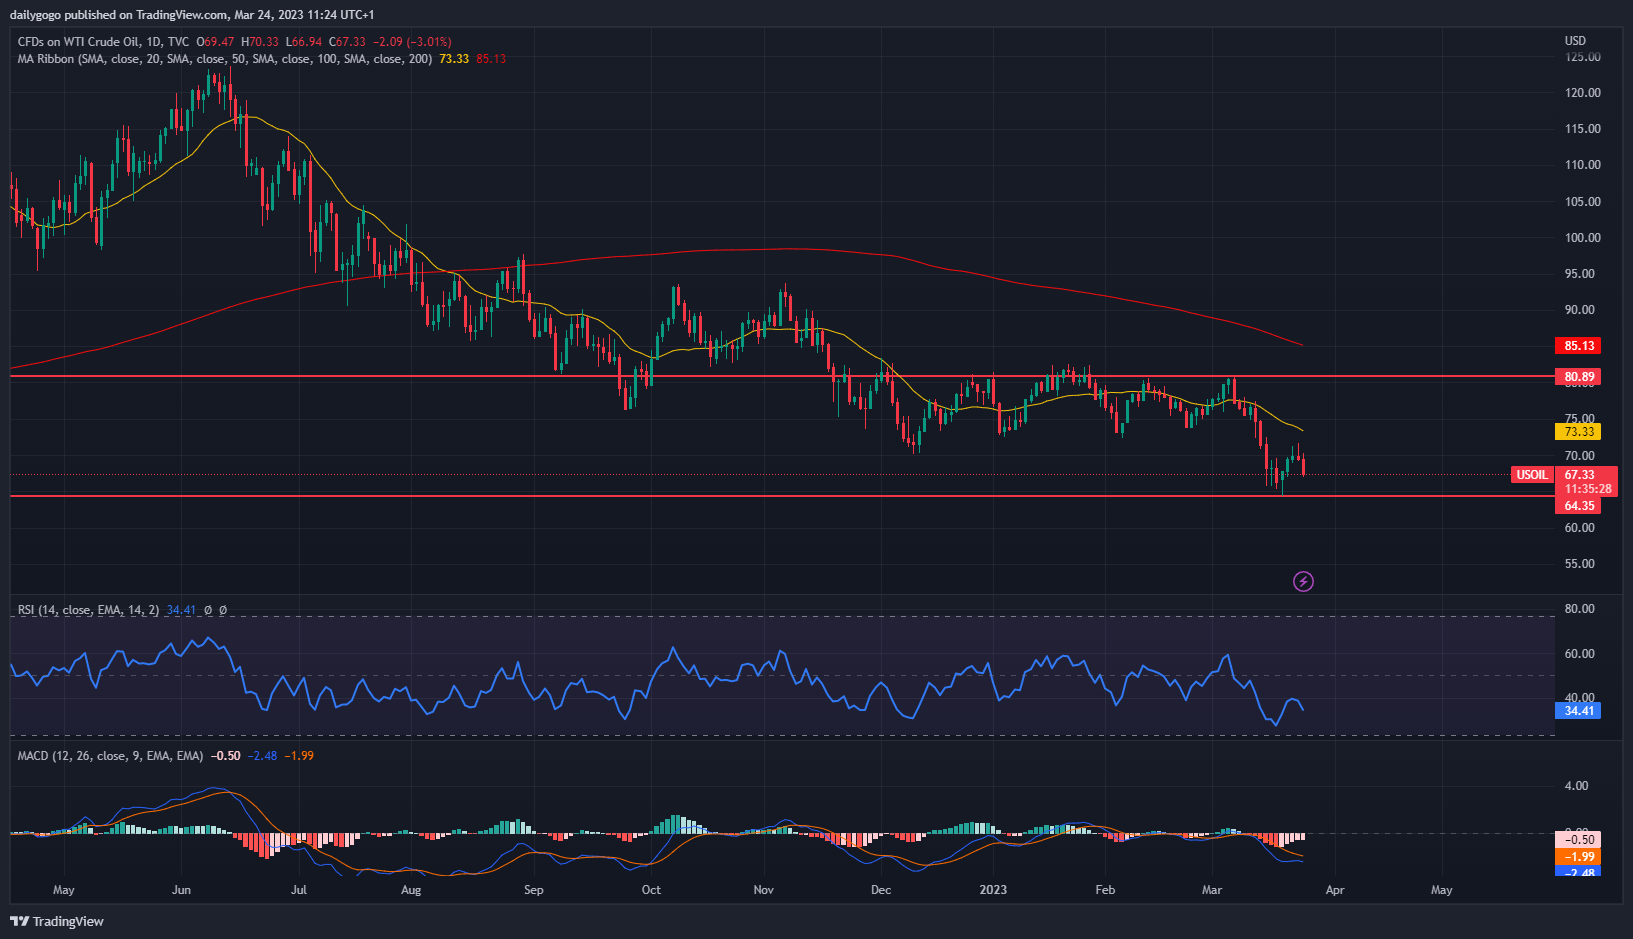
The price of Crude Oil WTI is currently testing a significant technical level, specifically a 61.8% Fibonacci retracement.
Here's a chart of the recent price movements for Crude Oil WTI:
As the market remains relatively stable, there is potential for the price of Crude Oil WTI to continue rising in the coming weeks if OPEC stays the course and if the weaker dollar allows better China fundamentals to shine through. However, tighter credit remains a risk that could negatively impact global oil demand.
GOLD
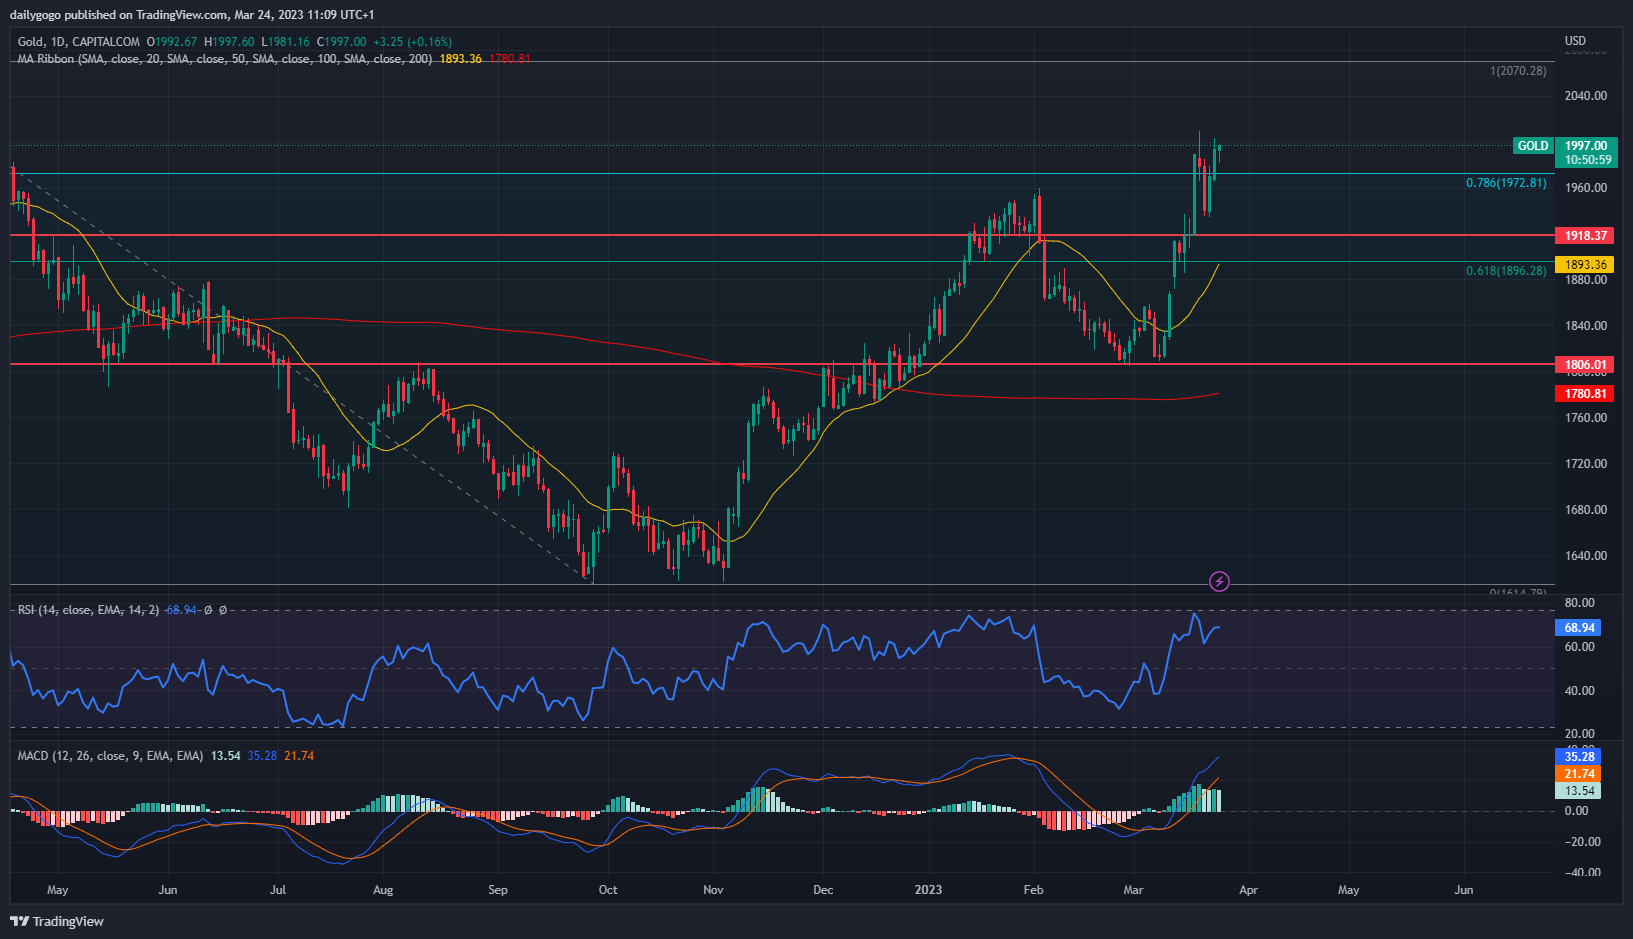
The spot price of Gold rose to above $2,003 on Thursday, before settling at $1,993.50. Gold regained upward momentum after a two-day slide as the DXY continued falling. A pause in Fed hikes could be hugely positive for gold, which is a contrarian trade to the U.S. currency.
The price of gold is currently testing a significant technical level, specifically a 78.6% Fibonacci retracement. For gold futures to reach a new record high, its value has to rise beyond $2,078.80. For spot gold to rewrite its all-time peak, it has to best $2,072.90.
No significant economic data releases are scheduled to be released today, which means that the direction of gold could be influenced by technical factors and overall market sentiment.
Here's a chart to help visualize the recent price action:
Based on this analysis, it's important to keep an eye on the technical level that gold is currently testing, as well as any shifts in market sentiment related to the dollar and the Fed's interest rate policy. Any significant moves in the DXY could impact the direction of gold in the short term. Additionally, any unexpected economic or political developments could also impact the price of gold, so it's important to stay updated on news events.
NASDAQ
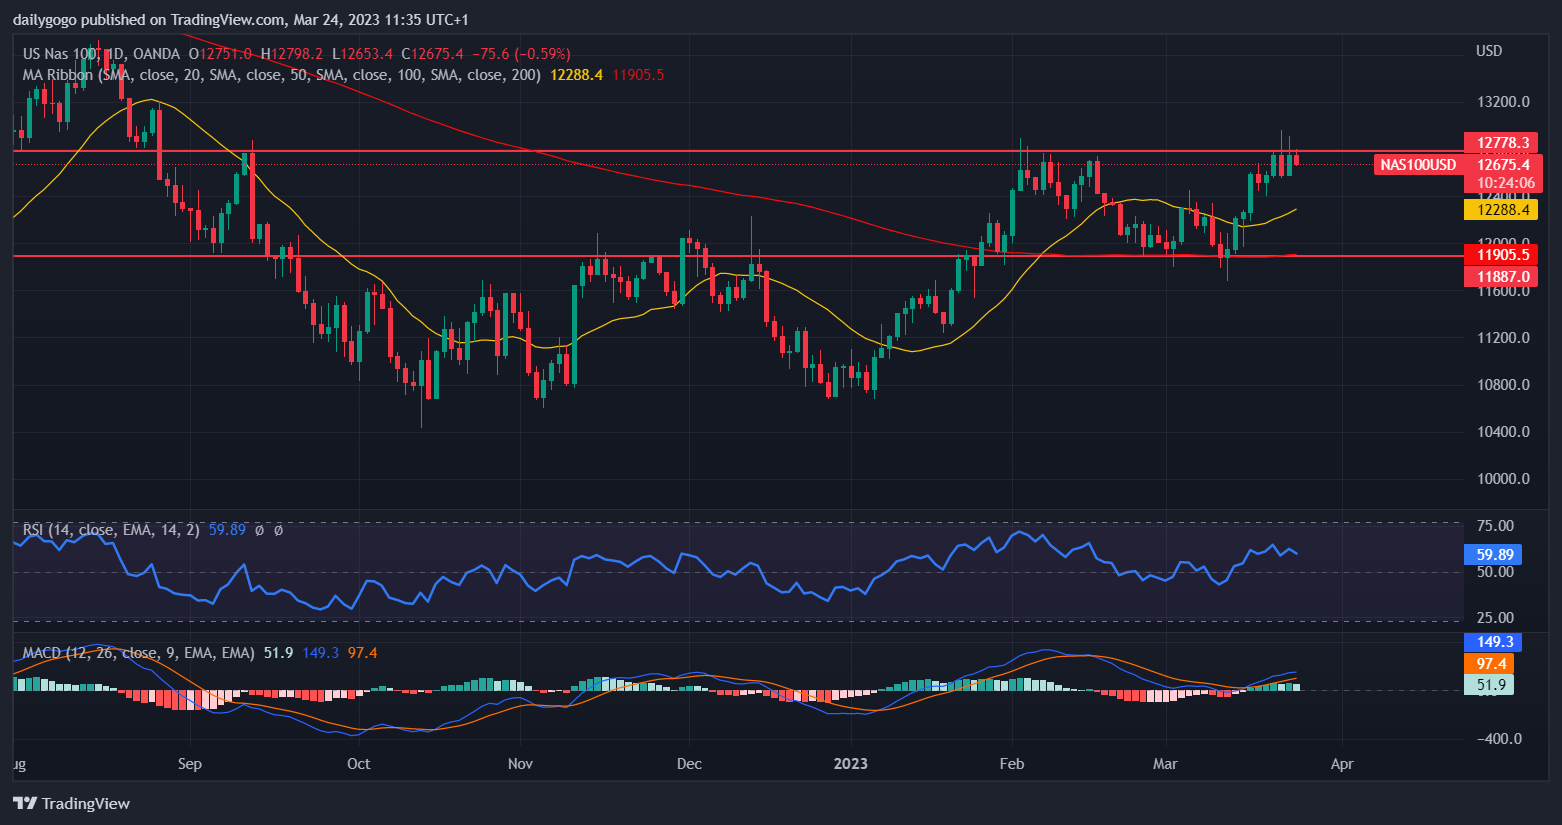
The Nasdaq 100 has recently seen a surge in bullish sentiment, reaching its highest level since early February, despite the rise in Treasury yields. This positivity has been fueled by speculation that the recent banking sector turmoil may be over, thanks to coordinated actions by government authorities to support the banking system, such as emergency central bank lending and the US Treasury Department's pledge to protect smaller lenders if necessary.
For continued bullish momentum, the Federal Reserve will need to convince investors that it will take necessary steps to prevent systemic risks from spreading, even if that means temporarily pivoting from its inflation fight.In terms of technical analysis, the Nasdaq 100 is currently testing a crucial resistance area at 12,900, where January's highs converge with the 38.2% Fibonacci retracement of the November 2021/October 2022 slump. If this area is breached on the upside, bullish momentum could accelerate, setting the stage for a move towards 13,700.
Here's an updated chart to help visualize the recent price action:
On the downside, if the tech index is rejected from current levels and resumes its decline, initial support can be found at 12,330. Further down, the 50- and 200-day simple moving averages come into play.
