EURUSD
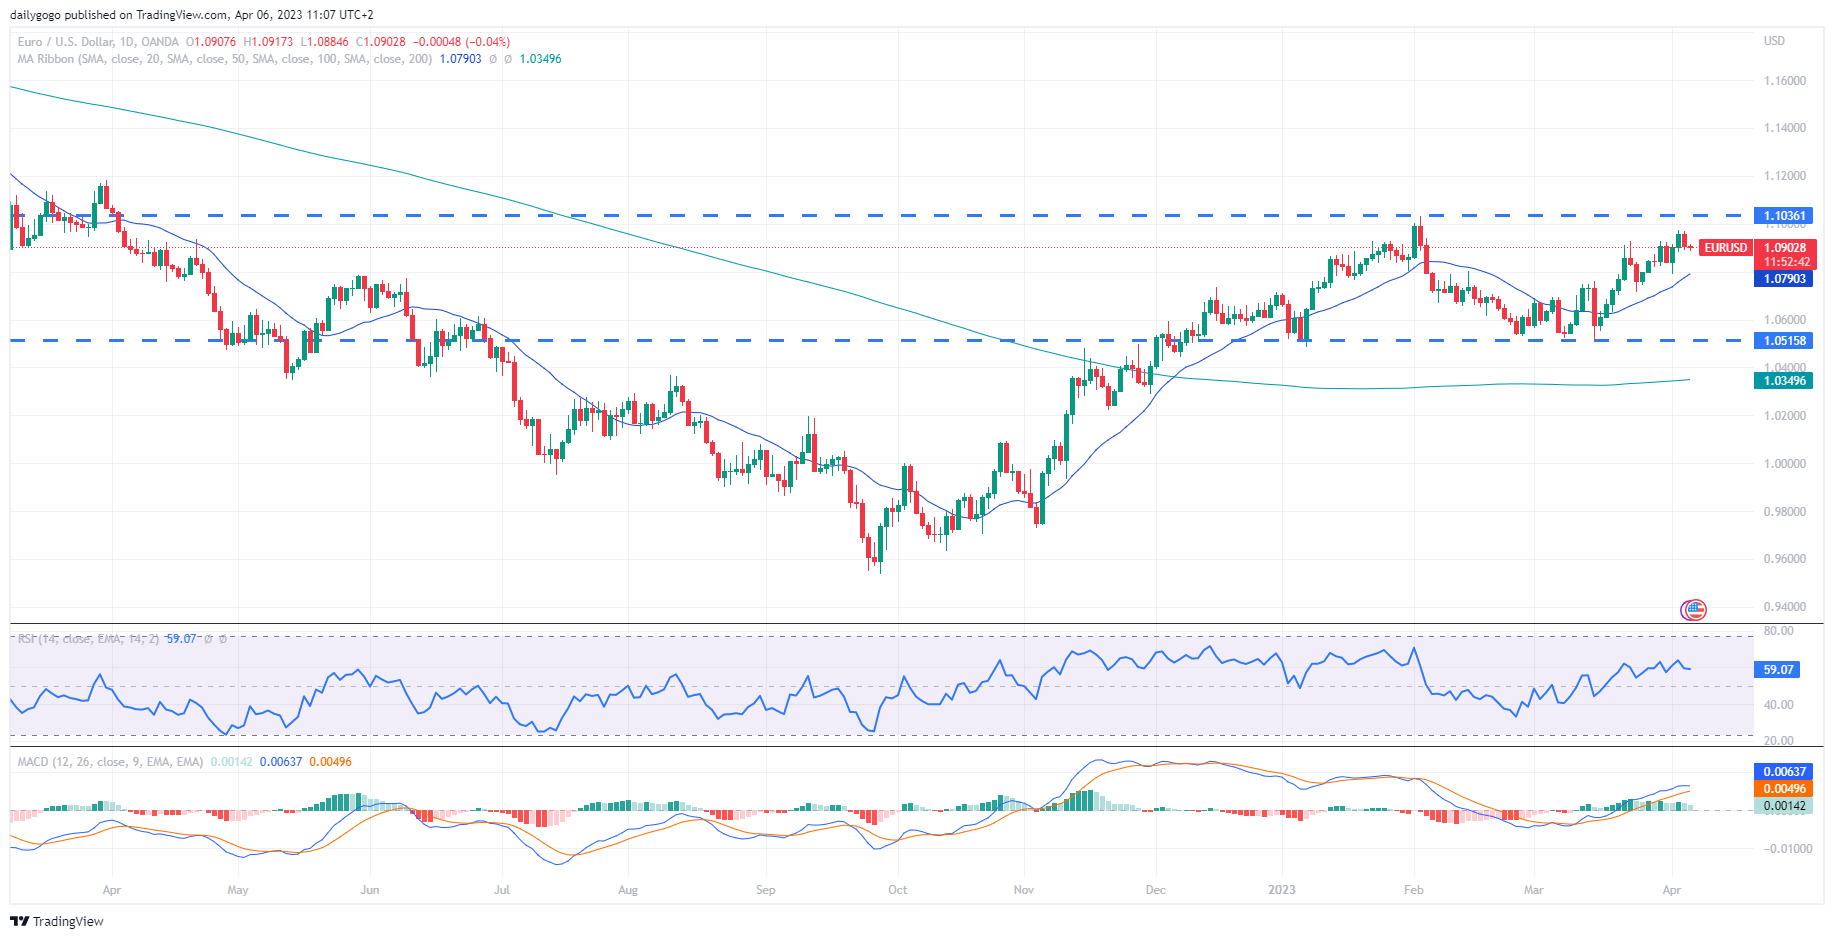
- EUR/USD is currently trading at 1.0903, remaining around the 50% Fibonacci level traced back from January 2021 highs.
- European stock markets moved higher on Thursday, driven by the positive growth in German industrial production, but investors remain concerned about a global economic slowdown, which is impacting risk sentiment.
- German industrial production rose 2.0% in February, which is significantly more than the 0.1% expected, according to the latest data released this morning.
- The European Central Bank is widely expected to continue hiking interest rates when it meets in May, as it aims to combat inflation levels that are still elevated.
- Investors are also keeping a close eye on the US NFP (Non-Farm Payrolls) report on Friday, as it is expected to greatly impact the dollar's price action ahead of the holiday weekend.
- In addition to the above, there are signs of market opportunity for traders to take advantage of. As mentioned, the European Central Bank is expected to continue hiking interest rates, which could support the euro against the dollar. Additionally, the recent positive growth in German industrial production is a positive indicator for the European economy, which could also support the euro.
- Furthermore, technical analysis shows that the EUR/USD pair is around the 50% Fibonacci level traced back from January 2021 highs, which could present a buying opportunity for traders looking to take advantage of potential upward momentum.
Closing statement: Overall, while there are concerns about global economic slowdown and the impact on risk sentiment, there are still potential opportunities for traders to consider in the EUR/USD market.
GBPUSD
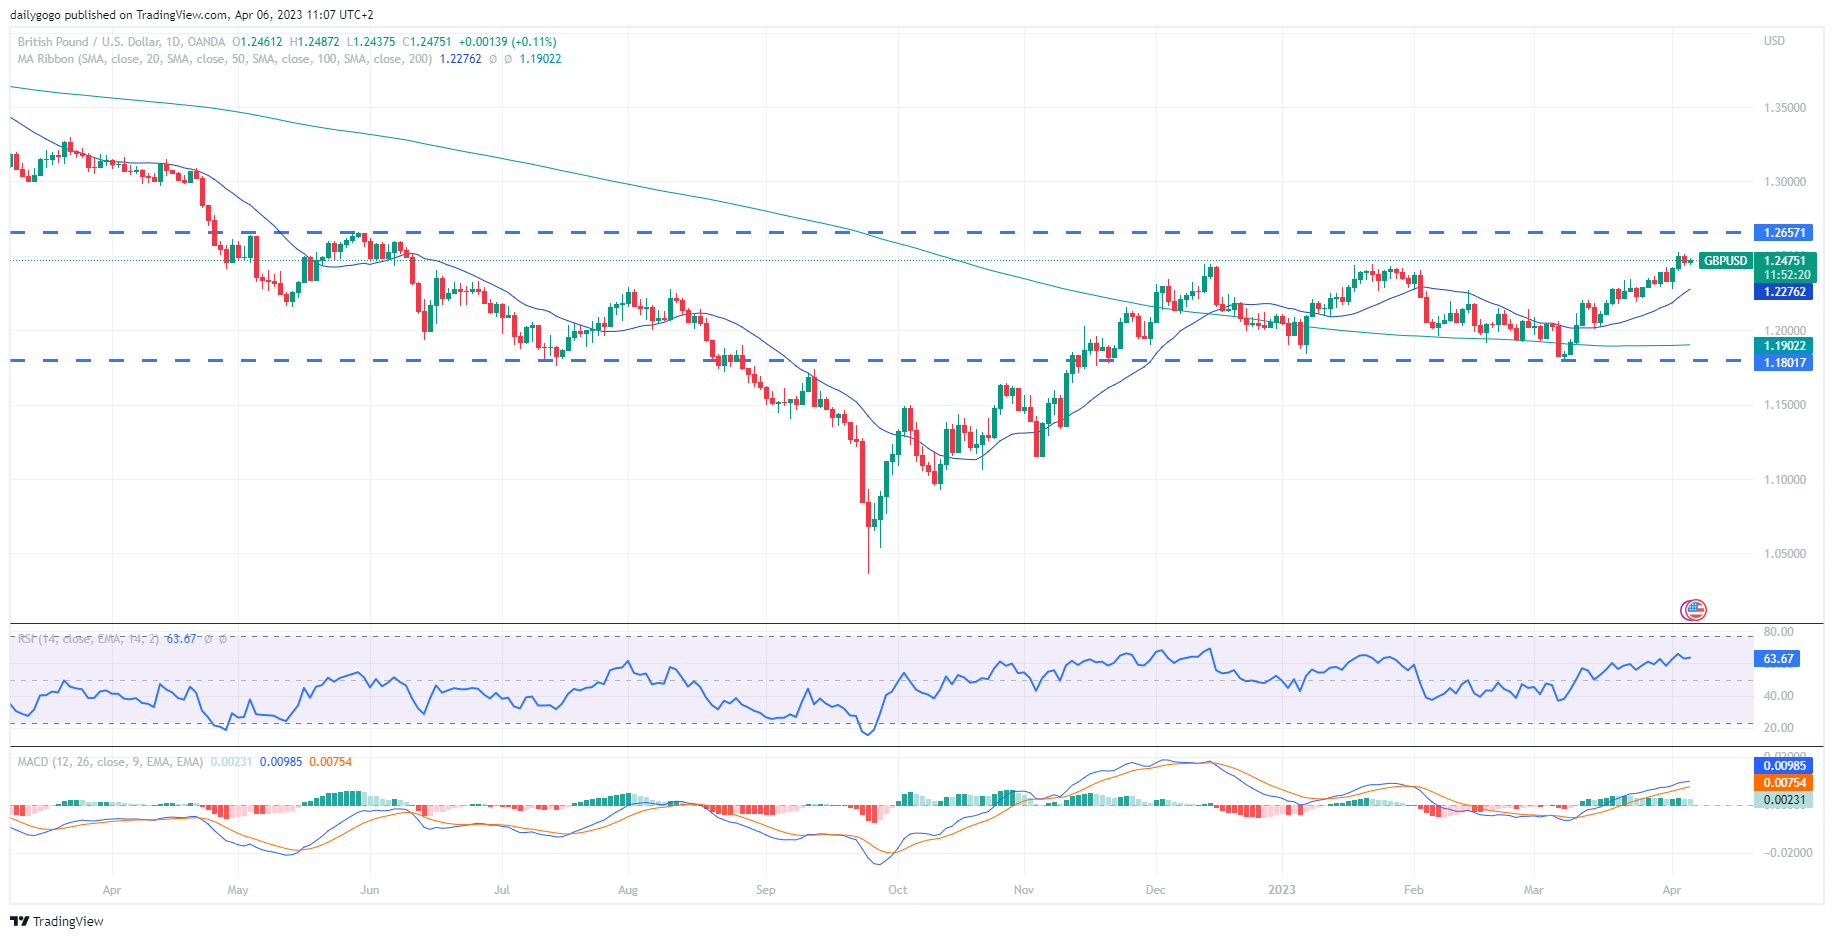
- GBP/USD increased to 1.2462, testing the resistance level at 1.24258.
- A sustained breakout above 1.2450 could lead to further strength towards 1.2650 or 1.2750.
- Bank of England's dovish comments by member Tenreyo did not affect the pound much.
- The DXY traded higher at 101.625, slightly above the previous session's two-month low of 101.140.
- Recent U.S. economic data has indicated a slowdown in growth, with the services sector expanding at a slower pace and job openings dropping to a two-year low in February.
| SMA (1D) | Rising | ||
| RSI (1D) | Neutral | ||
| MACD (1D) | Neutral |
Closing statement: The pound has been showing strength against the dollar, reaching a ten-month high and testing a significant resistance level. While there are concerns about the global economic slowdown, recent U.S. economic data has further reinforced this, which could continue to support the pound's strength. Investors should keep an eye on a sustained breakout above 1.2450, which could signal further strength towards higher levels.
GOLD
- Gold has seen an inconclusive session on Wednesday as it consolidates after some big rallies earlier in the week. Here are some key points to consider:
- The weekly jobless claims figure is due for release later in the session, but all eyes will be on Friday's official jobs report, with analysts expecting the economy added 240,000 jobs last month, lower than the number in February.
- The dollar started last month on a firm footing on expectations of higher interest rates, but the failure of two regional US banks in March and soft economic data have added to the growing belief that the Fed may soon stop increasing interest rates.
- The Fed has stated that they will remain data-dependent regarding following monetary policy decisions. For now, according to the FedWatch Tool, the chances of a no-hike are around 57% against a 43% probability of another 25-bps increase. This makes the data coming out of the US crucial for the direction of gold.
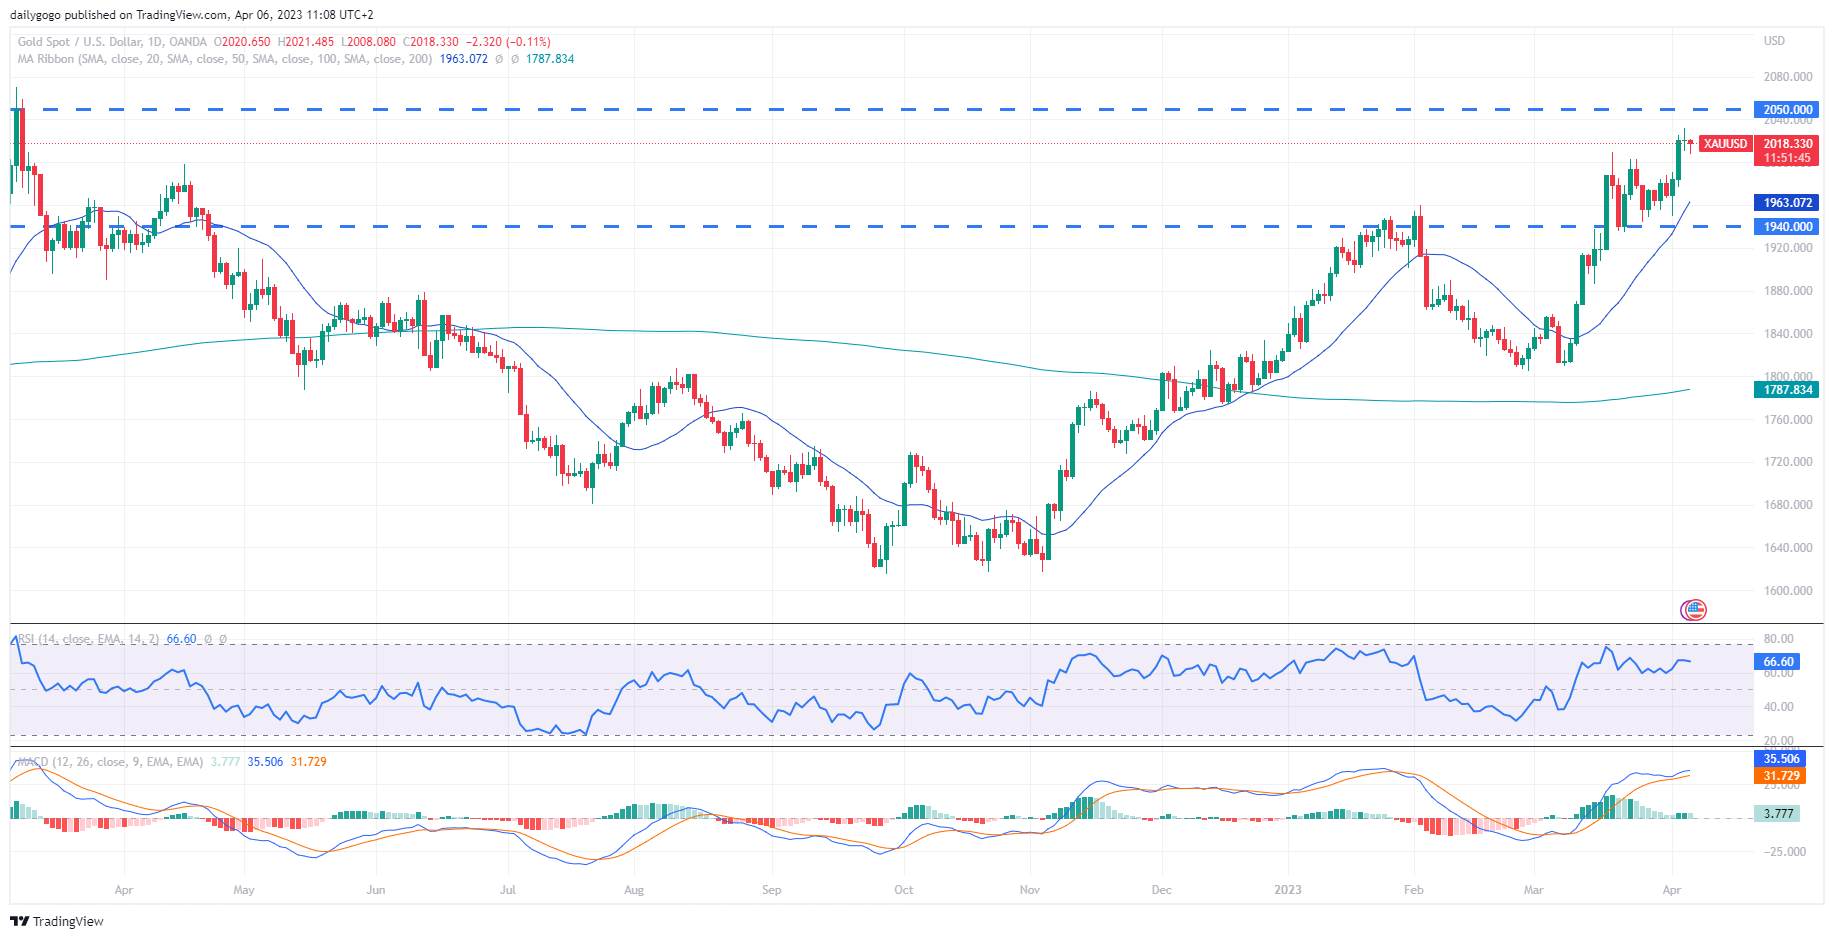
- From a technical point of view, gold maintains a strongly bullish outlook according to indicators on the daily chart, which are in positive territory.
- However, there might be a market opportunity visible, based on the technical analysis that there is a divergence happening, which could affect the price of gold to drop. The price has been going up since March 17th, but the RSI indicator was going down, which is a signal of a potential divergence. When the price direction doesn't match the direction of the RSI indicator, it usually causes the price to make a sudden jump or drop. In this case, it suggests that the price could drop, similar to what happened from 13th of January to 1st of February when gold went from around $1950 per ounce to $1811 per ounce.
Closing statement: Investors should closely monitor the upcoming job data as it will impact the Fed's decision and the direction of gold. While there is a bullish outlook for gold from a technical standpoint, the potential divergence could offer a market opportunity for those looking to invest in gold. As always, it is important to keep an eye on any developments that could impact the price of gold.
CRUDE OIL
- Crude oil prices fell on Thursday due to weak U.S. economic data, which raised concerns over a potential global recession and demand reduction. However, prices were still set to advance around 6% for the week after OPEC+ announced further output cuts and U.S. oil stocks dropped.
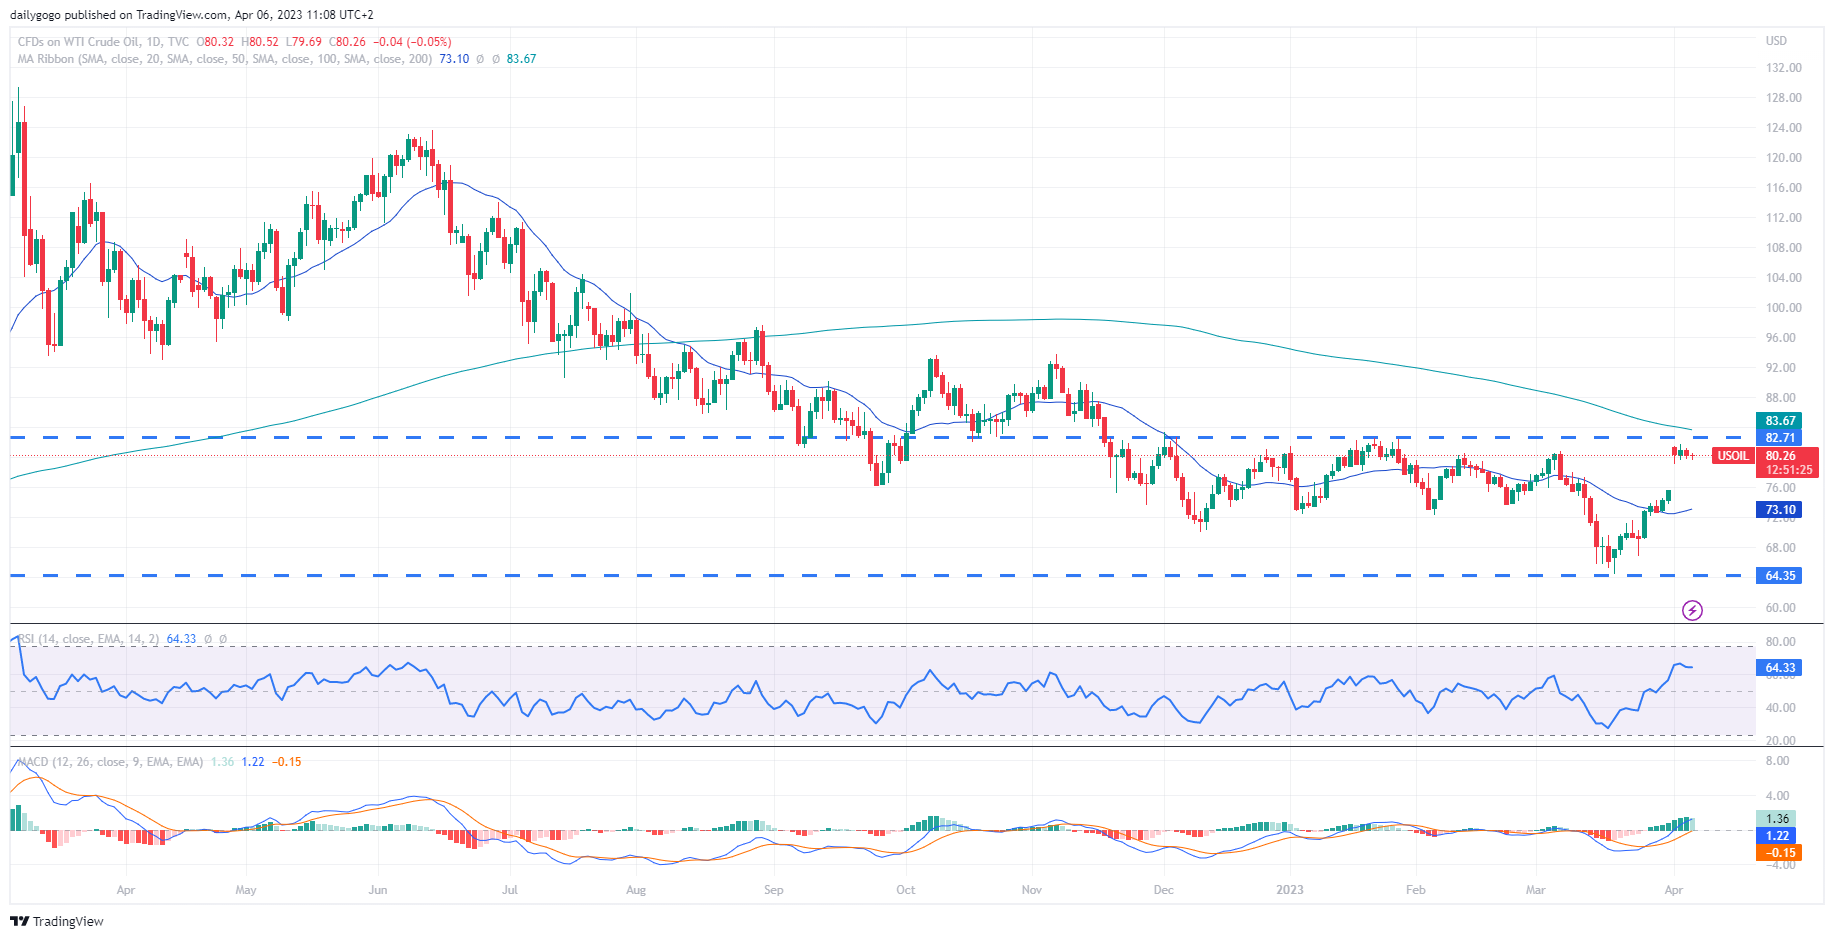
- From a technical perspective, crude oil bounced down from the 61.8% Fibonacci level traced back from the November 2022 highs and is now headed for a test of the 50% level.
- Saudi Arabia, the world's top oil exporter, raised prices for its flagship crude for Asian buyers for a third straight month.
- The latest US Energy Information Administration report showed US crude oil inventories fell by 3.739 million barrels in the week ended March 31, 2023, which exceeded market expectations of a 2.329 million barrel decrease.
| SMA (1D) | Slightly Rising | |
| RSI (1D) | Neutral | |
| MACD (1D) | Slightly Rising |
Closing statement: The crude oil market remains volatile due to various factors, including global economic conditions, output cuts by OPEC+, and changes in inventory levels. Investors will continue to monitor these factors closely to determine future price trends.
NAS100
- S&P 500 down -0.25%, Dow Jones up +0.24%, Nasdaq 100 down -1.01% on Wednesday.
- Weaker-than-expected US economic news on March ADP employment and March ISM services activity fuelled concerns about an economic slowdown.
- Worries that global economy will slow as central banks raise interest rates also weighed on stocks Wednesday.
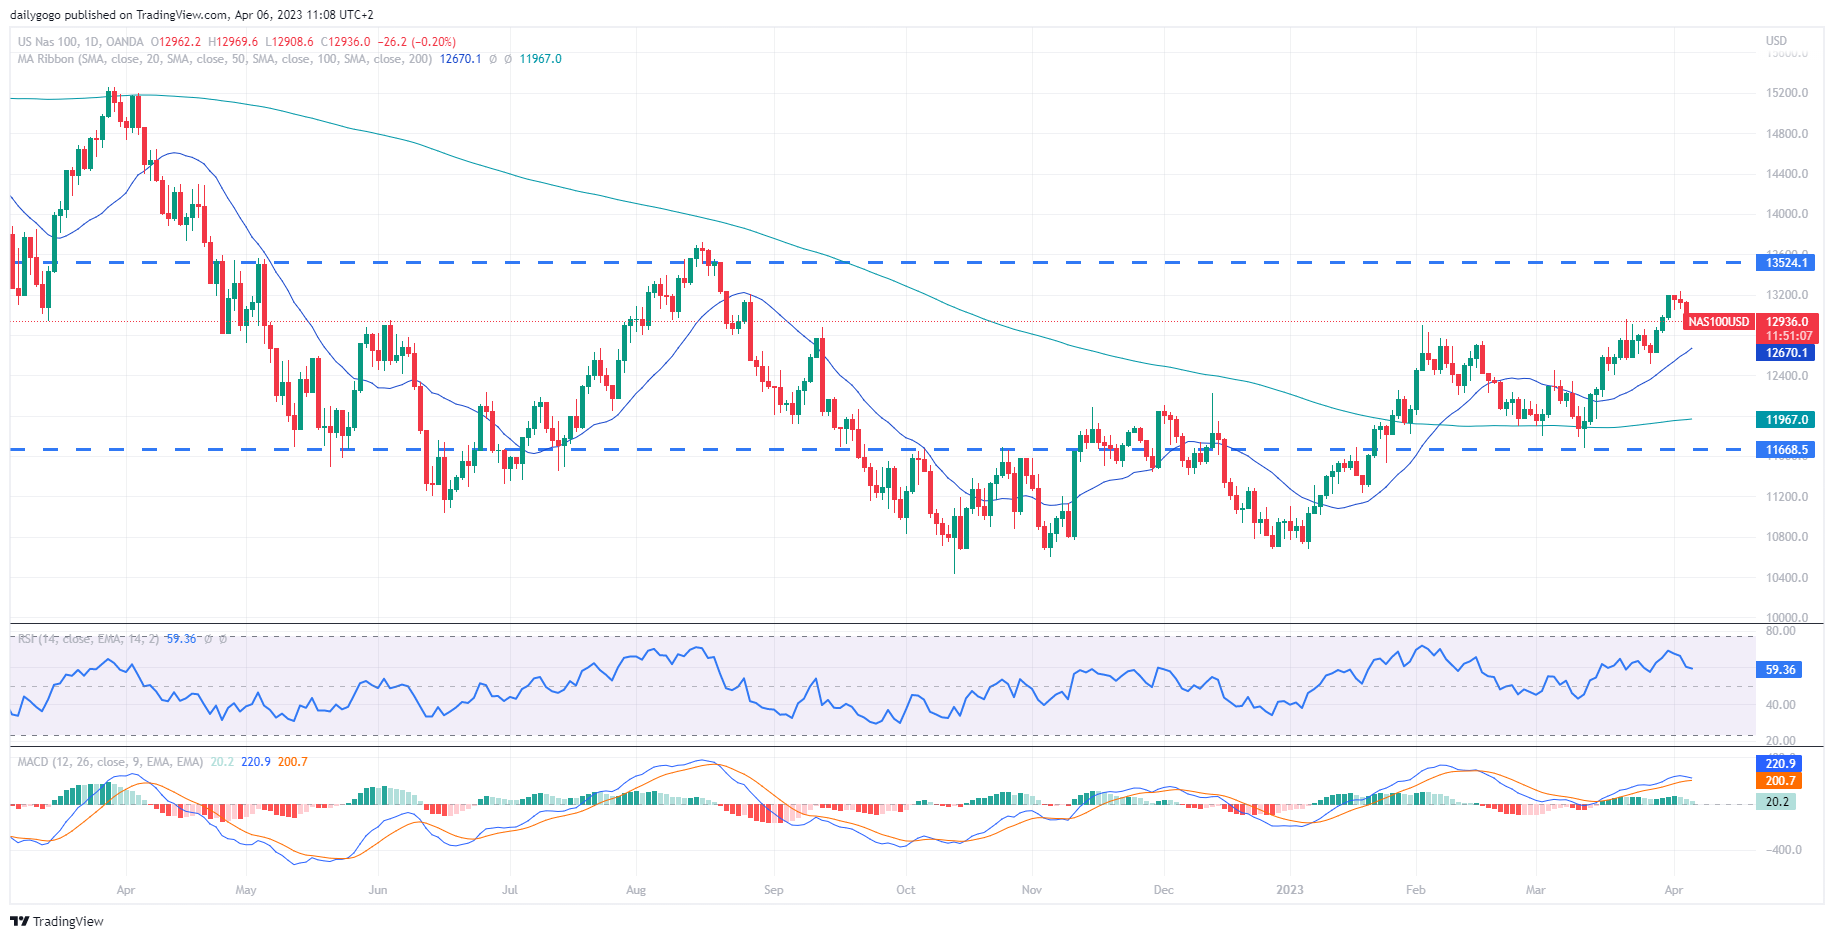
- From a technical point of view, Nasdaq is retesting some support levels that turned from resistance and the zone around 12900 is key for the continuation of the bullish bias surrounding this instrument.
| SMA (1D) | Rising | ||
| RSI (1D) | Neutral | ||
| MACD (1D) | Neutral |
Closing statement: The Nasdaq continued to face downward pressure on Wednesday, falling by over 1%, as concerns over the global economy and weaker-than-expected US economic data weighed on stocks. However, from a technical point of view, the Nasdaq is testing key support levels that could indicate a continuation of the bullish trend if they hold.
